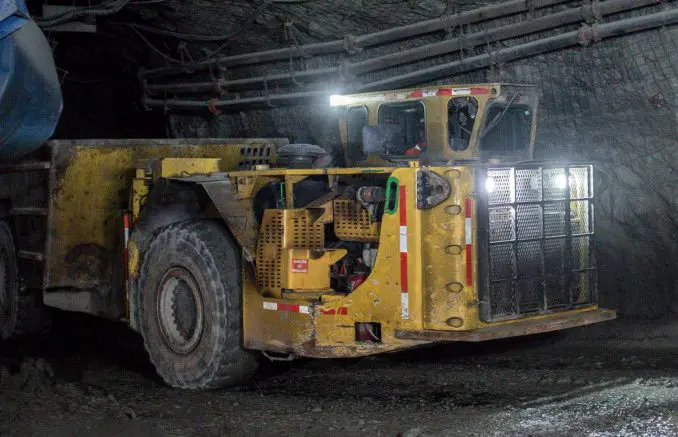
Picture of Wesdome's Eagle River

How Much Do You Make Working at a Mine?

Each year, Costmine Intelligence surveys mines throughout the United States, Canada and other parts of the world for information about wages, salaries, benefits, and incentive bonus plans as part of an extensive data collection program to monitor cost areas and produce its annual labor reports. 

In 2023, 126 mines in 31 U.S. states, representing over 35,000 mine employees responded to the Costmine U.S. mining compensation survey. Of the 126 mines responding, 45 industrial mineral mines, 46 metal mines, and 16 coal mines increased wages by an average of 3.7%, ranging from 2.0% to 10.0%, in the 12 months preceding the survey. Seven of the metal mines and 12 of the coal mines showed no change in wages. 

None of the mines decreased wages in the last 12 months. Eighty mines offered their employees the opportunity to increase wages through incentive bonus plans. In the chart below, hourly wages of several important jobs at mines are charted with data from the annual report. 

Listed in the full report are actual wage and benefit plan summaries for 53 metal mines, 45 industrial  mineral/aggregate mines, and 28 coal mines. All of the mines are identified by code number only. The information is presented essentially as provided to us by the mining companies, with minimal analysis or manipulation on our part. 

One hundred nine mines provided salary information, of which 51 were metal producers, 37 were industrial mineral and aggregate mines, and 21 were coal mines. This report also includes  executive compensation for over 350 Canadian and U.S. mining companies, traded on U.S. and Canadian stock exchanges. 

Want to learn more about Costmine Intelligence and how we can help you streamline your with your mining data needs?

Request a demo with a member of our team to get a personal assessment and discover what tools and data meet your needs.

Chris Berry

Vice-President Sales

Request a Demo

Related Insights

Content

Trucking Freight Cycle 2024, Part 1: Trends, Challenges & Market Dynamics

In the first part of our 2024 Trucking Freight Cycle series, we take a deep dive into the trends, challenges, and market dynamics shaping the industry. From evolving freight demands and rising fuel costs to regulatory shifts and economic uncertainties, this article uncovers the critical factors affecting carriers, shippers, and logistics providers this year. Discover the insights you need to navigate the trucking industry’s changing landscape.

Content

Benchmarking Copper Project Costs: Argentina Project vs. Sherpa Estimates

Compare operational and capital costs for a PEA-stage copper project in Argentina using Costmine’s Sherpa estimates. Learn how lower labor and administrative costs reduce OPEX, while Sherpa’s conservative approach ensures accurate CAPEX projections for real-world planning.

Jobs

Principal Analyst, Assets

Costmine Intelligence is working on several exciting new data, research and modelling initiatives that will grow our business and we are looking for research analysts to join our experienced team.

Free Data and Insights Delivered Directly to Your Inbox

Sign up for our newsletter to get regular updates on our products, along with free data, recommended posts on our Insights channel, and special opportunities.

Name(Required)
This field is for validation purposes and should be left unchanged.