
A growing number of companies are required to conduct due diligence to ensure that the sourcing of metals and minerals from conflict-affected and high-risk areas (CAHRAs) is done responsibly. This is due to the proliferation of regulatory and market compliance requirements that followed the establishment of the CAHRA concept within the OECD’s Due Diligence Guidance in 2011. Prominent examples include the EU Commission’s Conflict Minerals Regulation, which came into full force on 1 January 2021, and the LME’s Responsible Sourcing Requirements.
But CAHRA identification isn’t straightforward, as there is no definitive, official list of conflict-affected and high-risk areas. For example, the EU Commission funds the publication of an indicative list in support of its Conflict Mineral Regulation. But this is designed to be a starting point rather than a comprehensive solution, and only covers a narrow list of jurisdictions associated with the production of the four minerals covered by the regulation (gold, tantalum, tungsten and gold). The OECD Guidance, meanwhile, is explicit in saying that it applies to all minerals and is global in scope.
Focus Box: How does the OECD define a conflict-affected and high-risk area?
Conflict-affected and high-risk areas are identified by the presence of armed conflict, widespread violence or other risks of harm to people. Armed conflict may take a variety of forms, such as a conflict of international or non-international character, which may involve two or more states, or may consist of wars of liberation, or insurgencies, civil wars, etc. High-risk areas may include areas of political instability or repression, institutional weakness, insecurity, collapse of civil infrastructure and widespread violence. Such areas are often characterised by widespread human rights abuses and violations of national or international law.
Source: OECD Due Diligence Guidance for Responsible Supply Chains
Utilising our Country Risk Data to support CAHRA identification
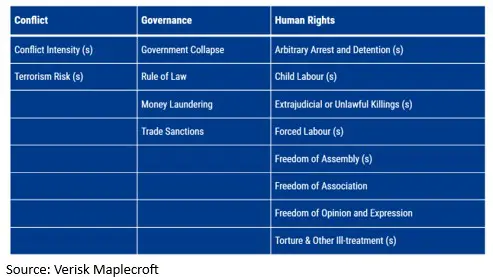
Verisk Maplecroft’s country risk data is a useful starting point for companies looking to begin their CAHRA identification journey. We have created a CAHRA configuration, which maps 13 of our proprietary risk indices against the OECD definition across three pillars: conflict, governance and human rights (see table below). Eight of the 13 indices are subnational, and all are updated on a quarterly basis, to ensure users benefit from granular and dynamic data.
Figure 1: Verisk Maplecroft’s conflict-affected and high-risk areas (CAHRAs) configuration
To illustrate this, an overall country ‘high’ or ‘very high’ risk categorisation could represent a red flag that warrants heightened due diligence. Of the 198 countries we assessed globally, 35 countries met this criterion, including major mineral producers such as DR Congo, Russia, Myanmar, and Indonesia.
Companies involved in the sourcing of metal and minerals may want to expand the net further. For example, Rwanda is categorised as medium risk under our configuration, in large part due to the lack of conflict within its borders. But Kigali is accused by the government of neighbouring DR Congo of exporting close to USD1 billion worth of smuggled gold, tin, tantalum, and tungsten a year – a red flag that should trigger an enhanced risk assessment for any firm sourcing metals and minerals from Rwanda. The UNDP’s guidance about whether a business should conduct heightened due diligence in a CAHRA-context is a good rule of thumb: ‘when in doubt, carry it out’.
Why does it matter?
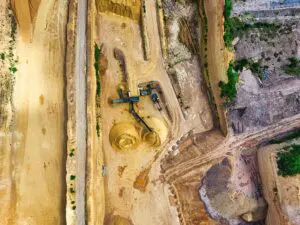
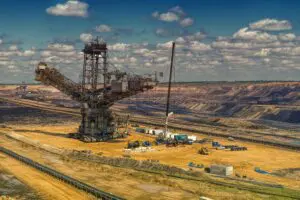
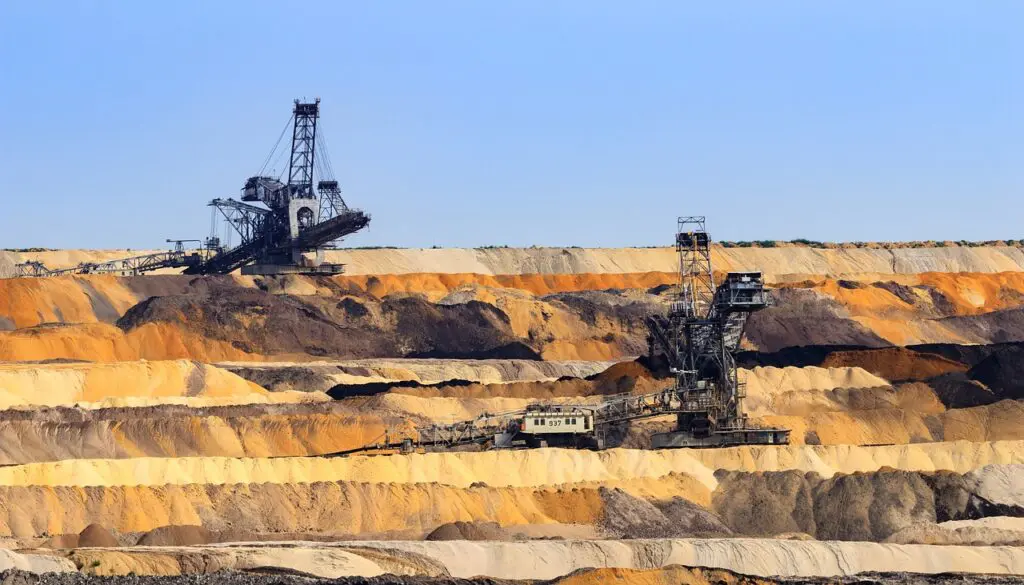
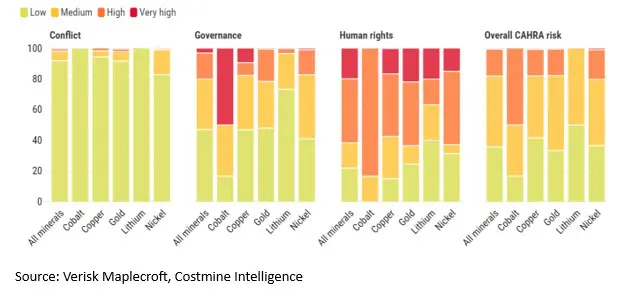
The importance of robust CAHRA identification as an early step towards effective responsible sourcing is underscored by the number of mine sites located in conflict-affected and high-risk areas. Using a combination of our data and asset locations provided by mining analytics platform Costmine Intelligence, we assessed the risk exposure of five key mined commodities – copper, nickel, lithium, cobalt, and gold.
We found that 18% of mine sites across those five mined commodities are located in areas rated ‘high’ or ‘very high’ risk within our CAHRA configuration and would thus warrant further due diligence (see chart below). While cobalt is (perhaps unsurprisingly) the most exposed mined commodity, with 50% of mine sites categorised as being in CAHRAs due the concentration of cobalt mining in DR Congo, roughly a fifth of copper, nickel and gold mines are similarly located.
The need to go beyond a narrow definition of CAHRAs is emphasised by the fact that less than 2% of mines we looked at are located in areas rated ‘high’ or ‘very high’ risk on the subnational conflict pillar of our configuration. The remaining 16% of mines we assessed are therefore categorised as being in CAHRAs due to their performance on our pillars measuring governance or human rights.
Figure 2: Percentage of mine sites exposed to CAHRAs and underlying risk issues
Verisk Maplecroft’s best-in-class country risk data is a useful tool to support CAHRA identification, particularly when paired with Costmine Intelligence’s asset data and other useful metrics such as mineral production and reserves. Please reach out via [email protected] if you are interested in better understanding how our data and consultants can support your responsible sourcing requirements.