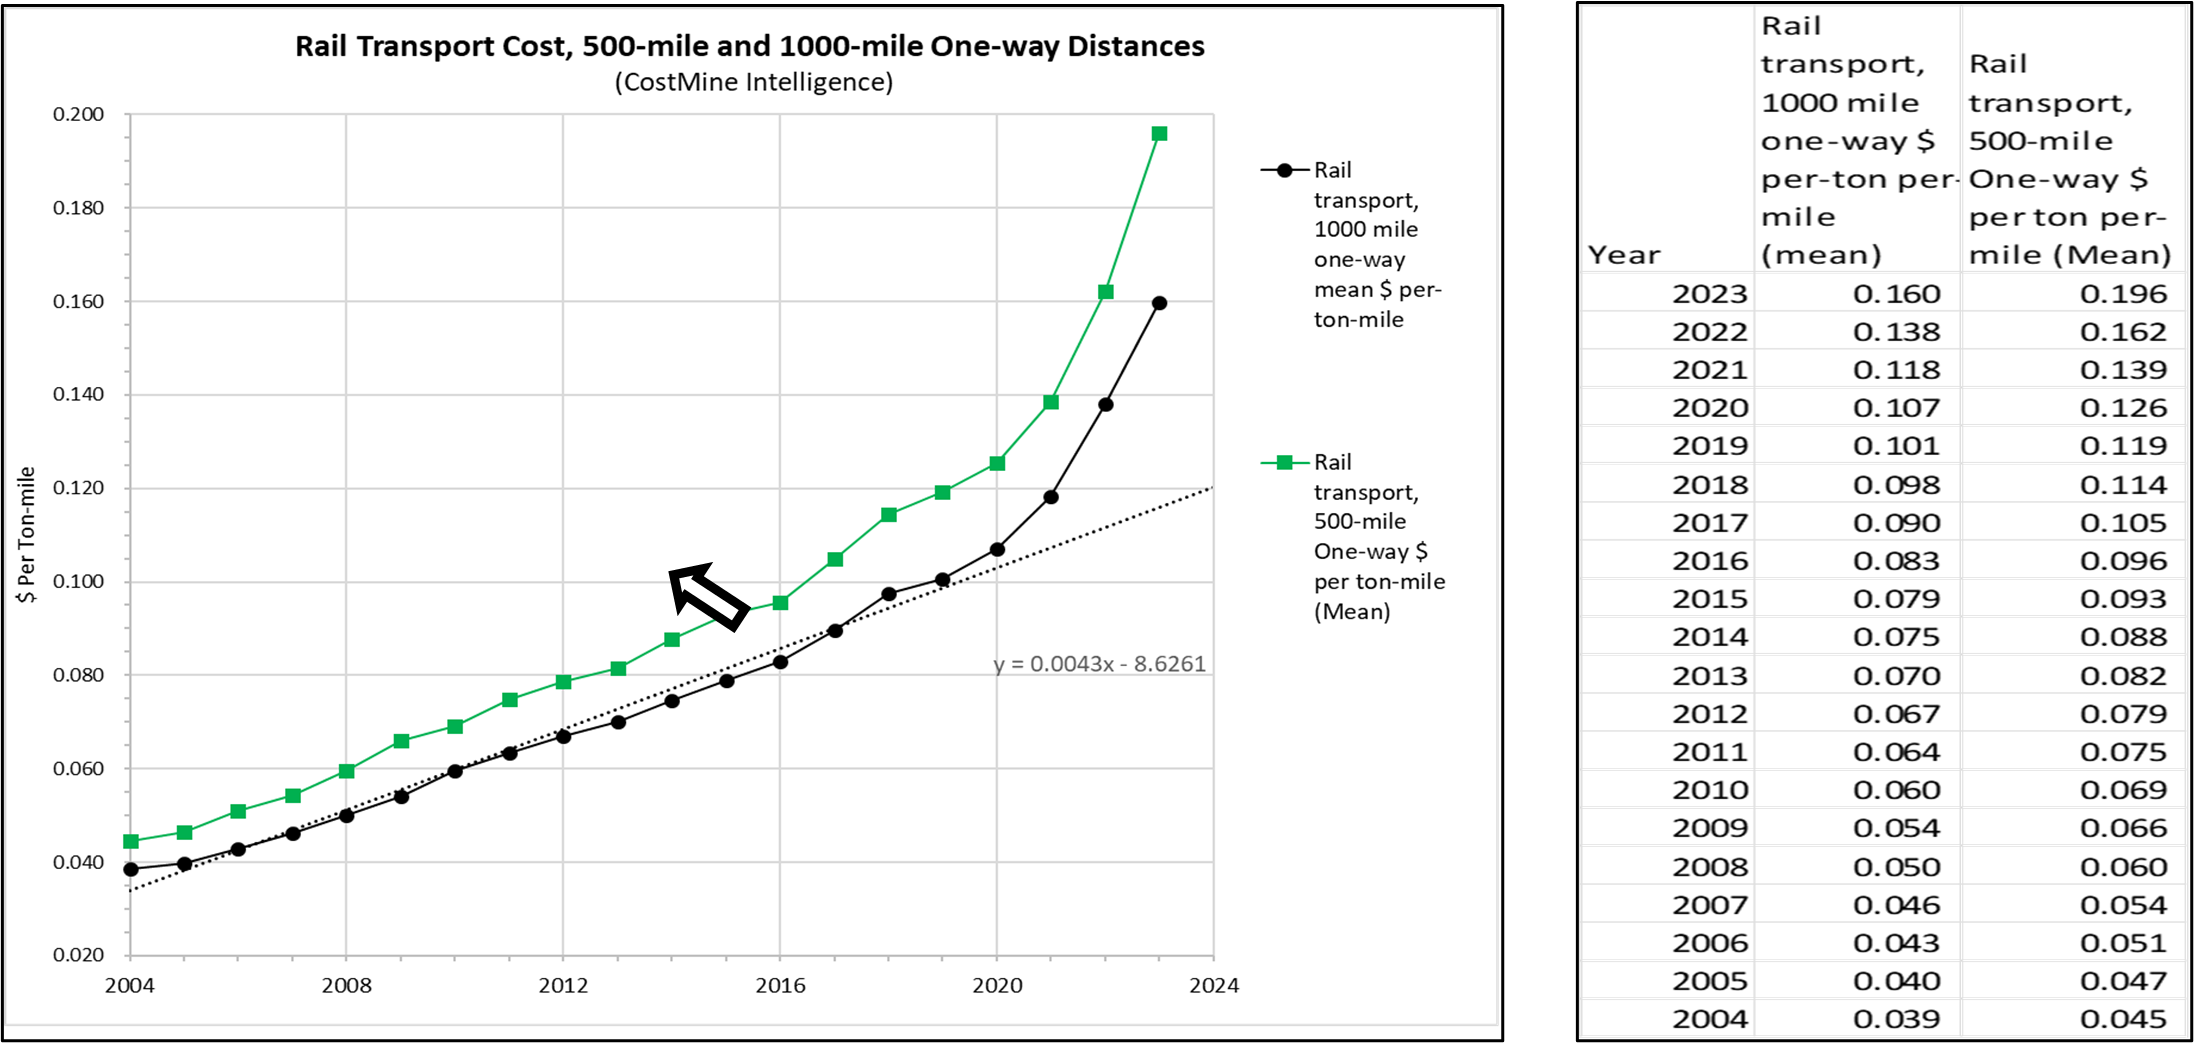
Our analyst’s review for rail transport over the past decades notes the abnormally large increase in the cost to move rail freight continues and new rates now persist for a third year. The new cost regime in transportation appears a more permanent fixture since the initial impact of Covid-19 continues unchanged. What is happening or what might be a cause of the much-steepened upward increase in cost seen since 2020? Figure 1 (and accompanying table) compares rail transport cost for distances of 500 miles and 1000 miles (in dollars per ton per mile) for the initial period 2004 to 2020, which then bends upward to 2023 in the recent period.
Initial period. From 2004 to 2020, the rise has been along a well-defined trend. The black curve for the 1000-mile distance helps to explain the rising trend. The average rate for 1000-mile cost trend from 2004 up to the time of Covid-19 rises at a smooth annual rate of $0.0043 per ton per mile each year (black dotted line depicts). Many unusual events coincided with Covid-19: schools and businesses shut down, and ocean freight was backlogged. The return to normal required about a year or two, but the rise in rail transport cost did not normalize, though it seems more permanent.
Recent period. After 2020, the initial trend no longer applies as the curve departs to a much steeper annual per-ton-mile trend. What is unusual is the much steeper rise in the cost for each of the green and black curves after 2020 (black arrow) forward, with cost climbing from $0.107 per ton-mile in 2020 to $0.160 per ton-mile in 2023. The year-over-year costs are increasing at a much faster rate per year in the recent period, with increases more than 4X larger than the initial 2004-2020 period because the year-over-year price trend climbed from $0.0043—the slope of a best-fit dotted line–pre-2020 to $0.0178 in the post-2020 period. This means the cost of transporting a ton of freight by rail for a 1,000-mile distance climbed from $98 per ton in 2018 to $160 per ton in 2023. Overall, this means that costs may double each 2 to 3 years rather than doubling each 10 to 15 years.
The rise in year-over-year trend is much larger for the shorter 500-mile distance when comparing the recent period to the initial period. The annual rate of increase for the initial period was $0.126 per ton-mile in 2020 compared to $0.196 per ton-mile in 2023. This is a more than 5X year-over-year increase to move freight for the 500-mile distance with costs rising from $57 per ton in 2018 to $98 per ton.
Figure 1. Rail transport costs 500-mile and 1000-mile one-way distances. Data presented here represents per-mile rail cost compiled from summaries provided annually by Terry Whiteside, transportation consultant. Source – Costmine Intelligence.
What factors might explain the sudden upward cost trajectory? Is other information available to support, deny or verify the increases in cost? The following four charts explore related data to find an explanation.
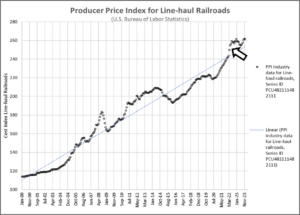
U.S. Bureau of Labor Statistics (BLS). Data for line-haul railroads from U.S. Bureau of Labor Statistics below (Figure 2) also confirms a change is underway as seen in observations discussed. The BLS producer price index for Line-haul Railroads rises above the trend line after 2021 (black arrow) following the dip below trend during 2020-2021. The producer price index indicates that business intensity has increased, by either price or volume but is not more specific as to a cause. Either one or both of these two explanations are possible; noticeable as (1) an increase in volumes of business or (2) an increase of rates per unit shipped. More detail is revealed from the examination of the monthly rate of change in the producer price index (not shown here, but available in the Transportation Chapter, Appendix B, of Mining Cost Service). The month-over-month change provides a clearer picture of the economic recovery underway in the recent period. This analysis also shows that business intensity in the 2020 post-Covid recovery exceeded rates following the 2008-2009 recession. Rail business accelerated at remarkably high rates from the beginning in June 2020 to a peak in January 2023 before returning to a normal trend year-end 2023. This observation would seem to indicate that a change in pricing is the preferred explanation. Let’s investigate further.
Figure 2. Producer price index for line-haul railroads. Source – Costmine Intelligence.
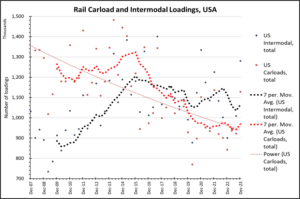
Carload and Intermodal Loadings. The Association of American Railroads collects loading data for the US, Canada, and Mexico for rail by carloads and intermodal units. Loading data in Figure 3 shows monthly loadings averaged by quarter year of rail cars and intermodal units (in 1000s) at US and Canada’s railroads (Assoc. of American Railroads, by permission). The curves show the number of carload (bold red dotted line) and intermodal units (black dotted) rising to 2015 followed by downtrends continuing through late 2023. Loadings at US railroads clearly show that business volumes continue to fall, with the downward trend more pronounced from 2015 to 2023. The thin red dotted curve is a best-fit trend of rail loadings from 2007 to 2023 to show loadings have decreased by 24.6% from an average of 1,320,000 carloads per month in 2008 to an average in 2023 of 995,000 carloads per month, with the January 2024 count at 1,025,168 carloads. Business volume has clearly decreased. A nearly identical but subdued downward trend in rail car loadings is also underway in Canada with a decrease in volume of 12.5% from 2015 to 2022.
Figure 3. Rail Carload and intermodal loadings, 2007-2023. Source – Costmine Intelligence.
An explanation for the initial question of the sudden upward cost trajectory now favors rate or price increases as the cause for sharp increases in cost, as loading data show shipper volumes are eliminated as a cause.
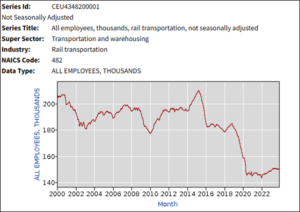
Employment, Fewer More Expensive Cars on the Rails, and PSR Supports. Is there more to the saga of high and increasing costs in railroading? The largest railroad companies earn revenue margins of 15 percent, and returns on capital invested are in the order of 12 to 14 percent (www.freightwaves.com). Data were not available on earnings of railroad employees, although employment in the industry (Figure 4) has fallen from about 190,000 before 2016 to about 145,000 today. Class 1 railroad employment (not including warehousing) was 122,343 in December 2023. Freightwaves.com says the cost to build rail cars has risen from $50,000 in the past to $150,000 today with about 100,000 more rail cars in service today at 1.6 million compared to 1.5 million in 2009. About 17% or 339,000 railcars remained in storage (not used or idled) of the total of 1,975,000 rail cars (AAR Oct 2021). Perhaps the most significant factor is that railroads now must operate under the rule of precision scheduled railroading (PSR) to protect against high speed and to reduce accidents and increase profits or operating ratios (the ratio of expenses to revenues). Costs of implementing PSR are borne by each railroad. Operating ratios have been sub-60 percent during the years-long period to implement PSR. Railroads continue to report that PSR provokes disruption at the 6 major US and 2 major Canadian railroads and negatively affects service. To reach sub-25% ORs, Chairman Oberman of the Surface Transportation Board says railroads must cut employment. This seems to be underway (Figure 4) but the result translates to higher costs borne by rail shipping customers.
Figure 4. Rail transportation employees, 2000-2023. Source – Costmine Intelligence.
The reason for the upward trend to explain higher cost is complex and no one reason can be identified as a single cause, so the cause involves multiple factors. It’s clear that increases in cost or rates best explain and translates to the much higher costs charged by railroads today.
More information to address the question of or to explain high cost is available for the 2023-2024 period entitled 2023-2024 Update – Rail Industry and Freight Rates is provided in Appendix B-Transportation (TR) a chapter in Mining Cost Service.

